

Price history that shows how a price really changes over time
Right on the product page, price history shows how the price has changed over the last 6 months: a clear chart, the current price, the lowest and highest prices and short-term changes, all in one place.
What this system does
Price history makes product prices more transparent. Customers see not only the current price but also how that price has changed over time.
The tab on the product page shows the latest recorded price, the lowest and highest prices in the recorded period and the changes over 24 hours, a week and a month.
What you see in the price history
6-month price trend
A clear chart shows how the price of the product has changed over the last 6 months.
Current, lowest and highest
Above the chart, you can immediately see the key price points in the recorded period.
24 hours, week and month
These figures show whether the price has recently risen, fallen or remained stable.
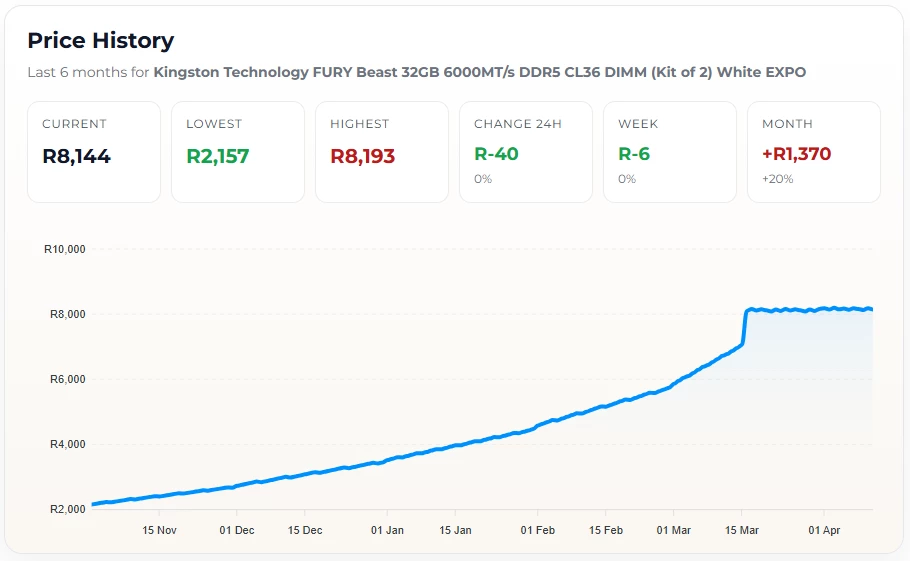
Price history combines a 6-month chart with compact key price figures, so your decision does not depend on the current price alone.
Why this is useful
A single current price only shows where things stand right now. It does not tell you whether the price is stable, has recently changed or has risen or fallen over a longer period.
Price history gives you context: you can better judge whether to buy now, keep an eye on the product for a while or compare its price trend with that of similar products.
How to read the summary
Current shows the latest recorded price.
Lowest and Highest show the main price range over the last 6 months.
The 24-hour, week and month figures compare the latest price with earlier records.
System rules
| Rule | How it works |
|---|---|
| Recording frequency | The system stores no more than one price record per product per day. |
| Price including VAT | The history is recorded based on the price as shown to the customer, including VAT. |
| Unavailable products | Products without a valid price or a suitable sales status are skipped for that day. |
| Retention period | The database keeps the most recent 6 months. |
| Customer display | The history is shown directly on the product page, in a dedicated information tab. |
Quick to read
The chart and the key figure blocks make price movements clear within seconds.
Controlled storage
One record per day and the automatic 6-month limit keep the amount of data manageable.
More context before you buy
Customers see not only the current price but also the recent trend.
Important note
Price history shows recorded past price movements and does not guarantee future prices. Prices may still change after the most recently recorded point. The current real-time price and availability on the product page always take precedence.
A clearer picture of product prices
Open a supported product, go to the Price History tab and see how the price has developed over the last 6 months in a clear chart.